Case Study: Investment Guru Pte Ltd [Financial Services] - "Measuring Online Engagement & Lead Generation

The Challenge
Investment Guru (a pseudo name) is in the financial services industry and their mission is to connect investors in search of Asian growth to corporate issuers in search of global capital. Their customer base is mainly of the older demographic as they are not seeing a new generation of customers interested in financial investing. Investment Guru needs to excite the new generation to become more interested in investing in order for them to become new customers of Investment Guru and its partners.
Plan - The Solution & KPI(s)
With the need to rejuvenate its customer base, Investment Guru decided to run a campaign that would challenge the new generation to become an investor. Once these new potential investors are interested, they would see Investment Guru as the go-to source of information and consider their services.
Their solution was to run a campaign that would lead potential new customers to their existing website, where they would have a campaign landing page providing a wealth of financial information for first-timer investors and an interactive platform that is engaging to the more youthful generation. The objective was to gain new leads amongst this population of younger investors, which they can then use to continue their relationship with.
To measure this objective, Investment Guru set 2 KPIs: (1) New total leads generated and (2) New qualified leads (those in the younger demographic age range) – based on information collected through online submission.
Quick Campaign breakdown:
- Objective: Attract new generation of investors
- Tactics: Search Engine Marketing, Paid social platform ads, Facebook post
- Time frame: 3 months
- Goal:
2000 new leads – Total number of leads generated from this campaign. 10% of which are within the age group of 25-35. Increment from existing benchmark of average 5% monthly generated leads which fall within this age group.
Measure - What was Measured?
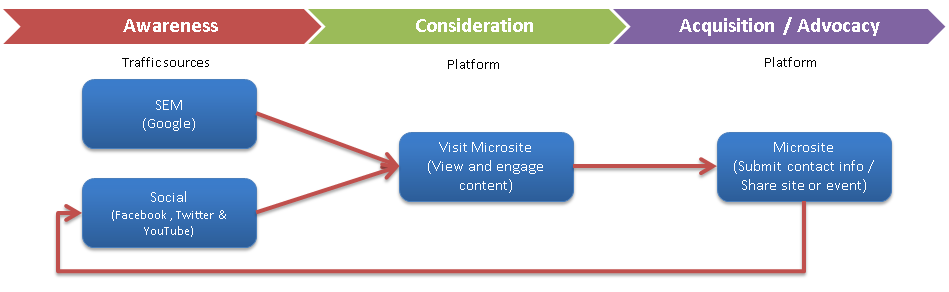
The overall concept of this campaign was about engaging younger potential investors to interact on Investment Guru’s campaign landing page, which sat on the company’s existing site. The campaign landing page provided resources that first time investors would be most interested in as well as engagement opportunities the younger generation would participate in such as:
- An online investment-related game
- Educational videos and webinars
- Forum to submit & share investment story
- Online registration forms to sign-up for offline events and seminars.
Having provided this wealth of financial information, visitors were able to submit their contact details for Investment Guru to contact them to further the relationship and start investing. The campaign was promoted through multiple marketing channels such as search engine marketing (SEM) and paid social media platforms (Facebook, Twitter & YouTube).
Customer journey consisted of the following touch points & measurement metrics:
| Stage | Channels | Diagnostic Metrics |
|
Awareness |
Paid
Owned
|
|
|
Consideration (Engagement) |
Owned
|
|
|
Acquisition/Advocacy |
Owned
|
|
Analyse & Optimise - Insights that Helped the Business
Not only was Investment Guru able to generate leads for their business amongst the new generation of investors, it also learned the behaviours and preferences of these potential leads. The measurement data gathered from the campaign helped them validate their assumptions and understanding towards the new generation. For example, the newer generation investors were more cautious when it comes to providing contact information on the internet as compared to the older generation. With this insight, Investment Guru prioritised and reduced the amount of information fields required on their existing lead generation forms and witnessed an increase of 30% in registration. The deprioritised / removed fields were later obtained when the lead become a customer.
With the user journey map and measurement data, Investment Guru identified key touch points that had unusually high drop offs, which affected the overall conversion rates towards their KPIs. For example, Investment Guru spotted that the drop off rates for their webinar registration was unusually high and with A/B testing of the layouts and reduction of form fields, Investment Guru managed to optimize the form and improve conversion rates. Through the hypothesis created and verified by their A/B testing, Investment Guru identified the optimal layout and field requirement configuration that would lead to better conversion/sign up rates. This is a valuable insight which can be used for future campaigns and online form development.
- Map customer journey against measurement data to identify key drop-off points that affect your overall conversion rates.
- A/B testing enables you to test and validate hypothesis to optimize your marketing
- Objective: Increase online sales
- Tactics: Search Engine Marketing, Paid social platform ads, Facebook post, TV commercial
- Time frame: 1 month
- Goal: Sell 2000 bundles – Total number of online bundle sales
Measure - What was Measured?
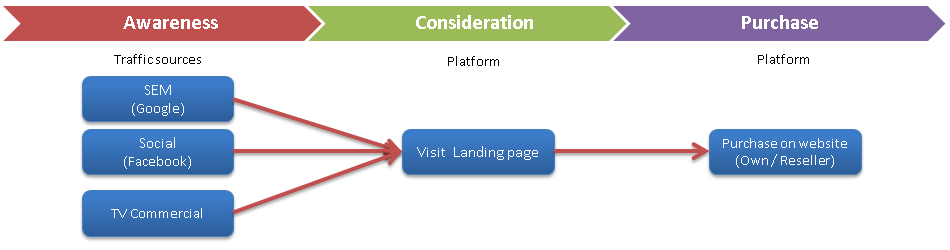
The overall concept of this campaign was about driving sales of this promotional bundle online with the help of traditional TV commercials. Having seen the TV commercial with the easy to remember vanity URL to the regional landing page, customers can either search online for Phoenix Trading’s promotion or go directly to the promotion’s landing page. On the landing page, customers can click-thru to Phoenix Trading’s local online resellers in their country.
Customer journey consisted of the following touch points & measurement metrics:
| Stage | Channels | Diagnostic Metrics |
|
Awareness |
Paid
Owned
|
|
|
Consideration (Engagement) |
Owned
|
|
|
Purchase |
Owned
|
|
Analyse & Optimise - Insights that Helped the Business
With this regional bundle promotion, Phoenix Trading saw a 43% increase in their online sales and an 18% increase in new customers from their existing customer database. This included a new customer base that were originally not on their radar – small offices who wanted to buy their products in larger quantities unlike individual household customers who tend to buy small quantities at a time.
By breaking down click through data on the landing page and bundles sold data by country/reseller, Phoenix Trading can identify the amount of traffic they have contributed to their resellers’ website and the conversion rate (bundles sold) that takes place at their reseller’s website. This puts Phoenix Trading in a better position when doing contract negotiation on commission and sales quotas with their resellers.
Based on the traffic sources data on their landing page, Phoenix Trading was able to identify which marketing channels had greater influence for the different countries. For example, countries that experienced higher vanity URL, direct & organic traffic with low paid & referral traffic suggested that the offline infomercial TV ads were more effective for that country. With these insights, Phoenix Trading maximised their limited budgets for the year by prioritizing which marketing channel to be used for which countries. Also, for paid search, they have also identified the keyword strategy that would work best for future campaigns. For example, branded keyword phrases (search phrases that included their brand name + product type) were more effective in bringing traffic to the website than those non-branded (search phrases that only included product type). This insight will help Phoenix Trading focus their future budgets and efforts in writing and purchasing branded keyword phrases with search engines.
- Offline marketing influence can be tracked with the help of online analytics platform (keeping in mind these are approximations and may be under-represented)
- Observe and identify the marketing channels that have greater influence in different countries to prioritize marketing budget more effectively and increase marketing ROI